Notes:
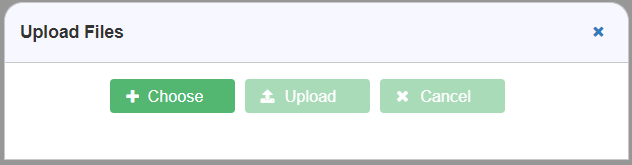
- The user has to choose the file which they want to upload by clicking on the Choose button
 , after choosing the file the user has to click on the Upload button
 in order to upload the selected file.
 - If a user doesn’t want to upload the file, they can click on the Cancel
 User can also choose multiple files, in case user chooses multiple files they can click on the Close button
 alongside the file.
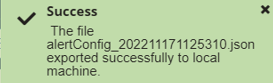
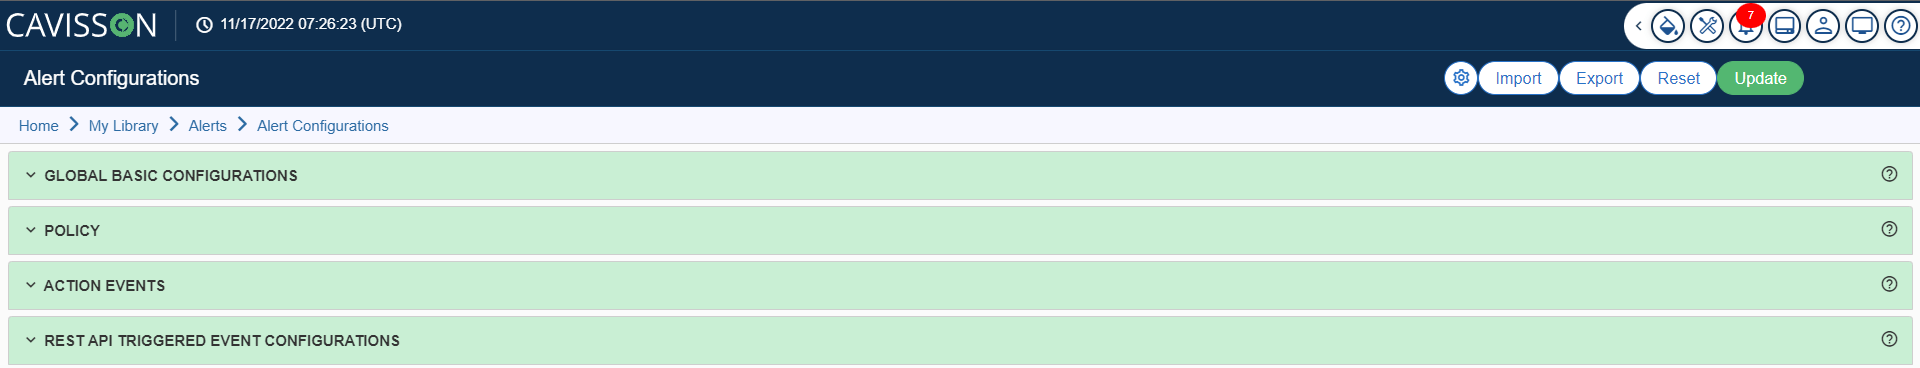
Export
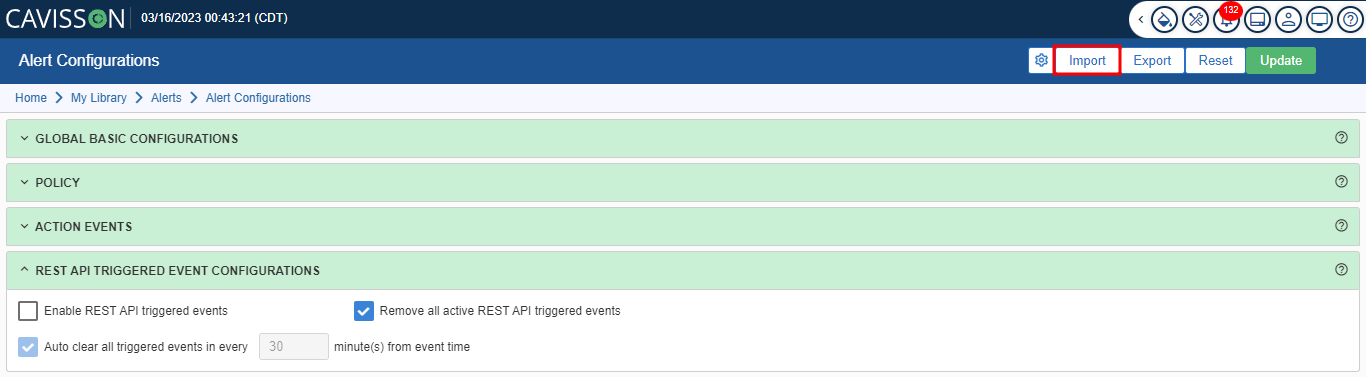
To export the alert configuration in the form of a json file, click the Export button![]() . The configuration file is exported to your local machine with some predefined naming conventions. A message is displayed at the top-right corner of the window for the successful export of the file.
. The configuration file is exported to your local machine with some predefined naming conventions. A message is displayed at the top-right corner of the window for the successful export of the file.